
Wang Mingchuan
Year 4 Mechanical Engineering
A0240129N
5. Mechanical
5.1 Scope of Work
- Design specifications and manufacturing of module parts:
- I have to design and manufacture the chassis and structure of the module to house all the components, including the shielding. The module has a dimension limit of 1U by 1U by 0.5U and mass of 0.6kg, in accordance with CubeSat standards.
- Prototype testing and set ups:
- To qualify the module for flight, it must pass a series of required tests such as vibration and thermal tests. As part of the development process, test setups and mounting jigs were designed to ensure that the module could be securely interfaced with the test equipment.
- Simulations:
- Simulations were conducted to verify the mechanical and thermal feasibility of the design prior to physical testing. These include structural simulations and thermal modeling.
- Results and evaluations:
- Post-test analysis was conducted to assess whether the module met flight qualification standards. If the results indicated failure, design revisions would be made to address the issues.
5.2 Mechanical Architecture
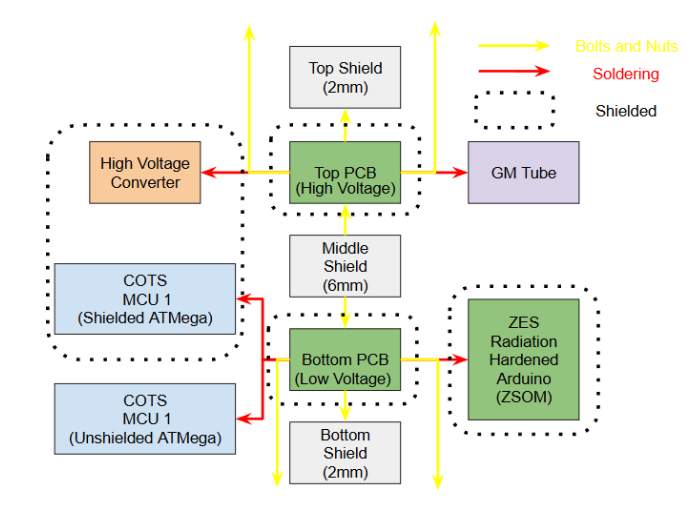
Figure 5-1 below shows the mechanical architecture diagram. It provides a high-level overview of the system and indicates the mechanical interfaces between each component.
5.3 Design and Manufacturing of Module
Throughout the iterations, we continuously updated and improved our design. We have arrived at our final design after 3 main iterations. The module will be a sandwich structure with 2 PCBs, the top PCB for high voltage and the bottom PCB for low voltage. The 2 PCBs will be held together by a middle layer of shielding of 6mm, and protected with another layer of 2mm shielding from the top and bottom, as shown in Figure 5-2 below. The modular design allows the two PCBs to be worked on separately before final assembly. This also provides additional electrical safety as the high voltage PCB is less likely to damage the low voltage PCB. Design of the previous iterations can be found in Appendix E1.
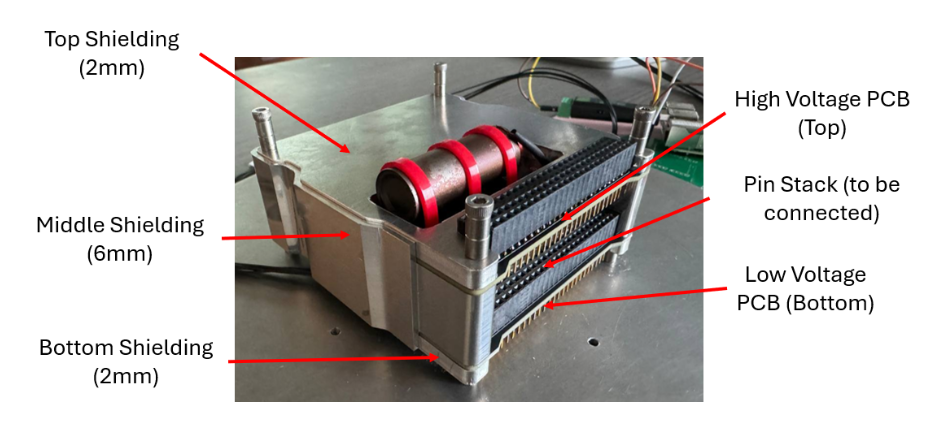
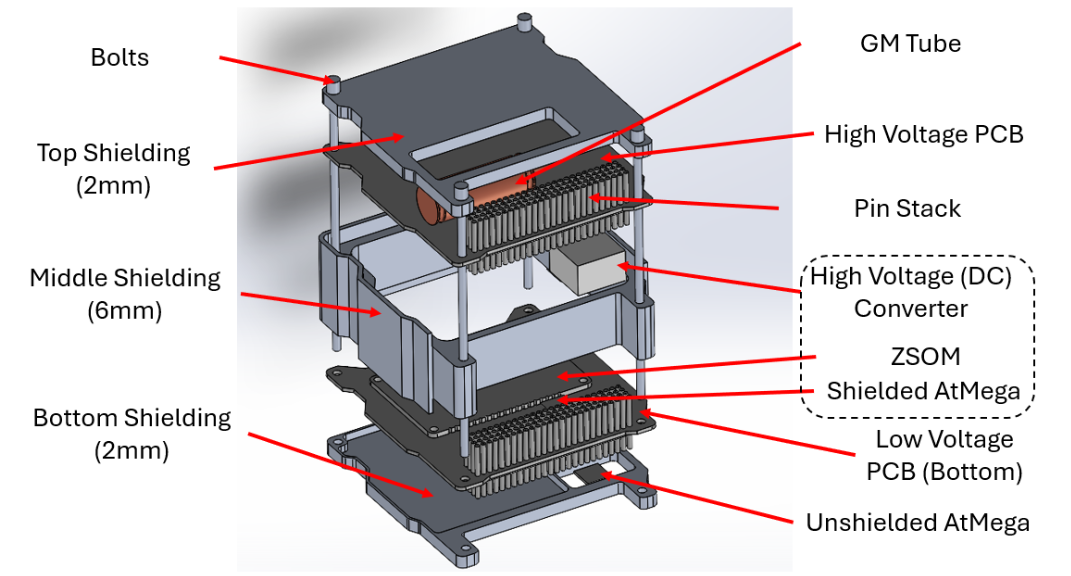
The protected components (as highlighted in the dashed box in Figure 5-3) will be on the inner side of the PCBs, protected by 6mm of aluminium on the sides by the middle shielding, and protected by the PCB and another 2 mm of shielding from the top and bottom as shown in the exploded view in Figure 5-3. A more detailed view of the CAD can be found in Appendix E2.
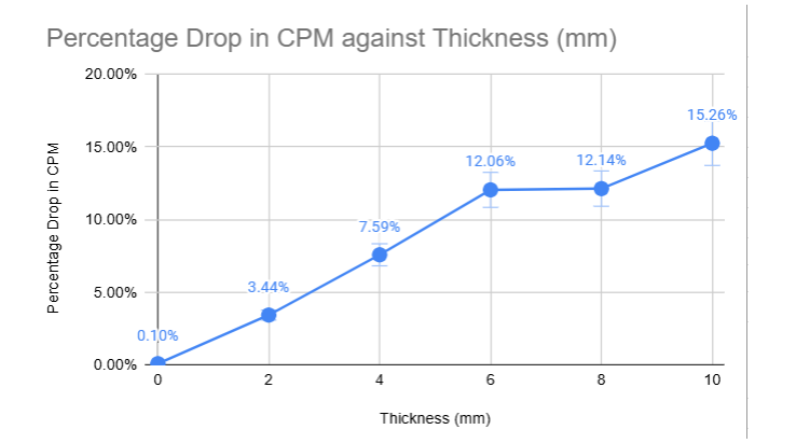
We selected aluminium as the shielding material due to its favorable shielding effectiveness, high availability, and ease of manufacturing. A more detailed justification can be found in Appendix E3 and the interim report. The middle shielding layer was designed to be 6 mm thick, based on both space constraints and experimental results on radiation attenuation. Since the module must fit within 1U by 1U by 0.5U CubeSat volume, 6 mm is the maximum feasible thickness. Our experiments also indicate that shielding performance plateaus after 6mm. Further increases provide diminishing returns in shielding effectiveness, as shown in Figure 5-4. The experiment is done using commercial off-the-shelf (COTS) GM counters and aluminium shielding boxes. The details of the breakdown can be found in the interim report and the breakdown of the data can be found in Appendix E4.
The top and bottom shielding is limited to 2mm due to the height limitations. We will be comparing the impact of radiation on components with 0mm of shielding and 2mm of shielding, with the original bit pattern.
| Data for comparison | 0mm |
| 2mm | |
| Original bit pattern |
The shielding is manufactured using CNC as it gives a stronger structural integrity than additive manufacturing. In addition, it gives better precision and tolerance levels. This ensures the part can withstand mechanical testing.
Given all considerations, the final design of the module has a dimension of 94.33mm x 96.39mm x 48mm and mass of 388.5g, which is within the required design specifications. The bill of material and mass budget can be found in Appendix E5. Additional physical parameters such as centre of gravity and moment of inertia can be found in Appendix E6.
5.4 Testing Requirements
In order to qualify the module for flight, we will have to send it for qualification tests. This ensures that our module can survive launch conditions and that all components are securely fastened. We will be using the launch guide by SpaceX as it was the requirement by In-Space Missions (FalconUsersGuide, 2021). We will be running it through the required tests: static loading, sine vibration, random vibration and EMC. In addition, although not required, we will still be doing a truncated version of the thermal cycling to stress test our components under extreme temperatures.
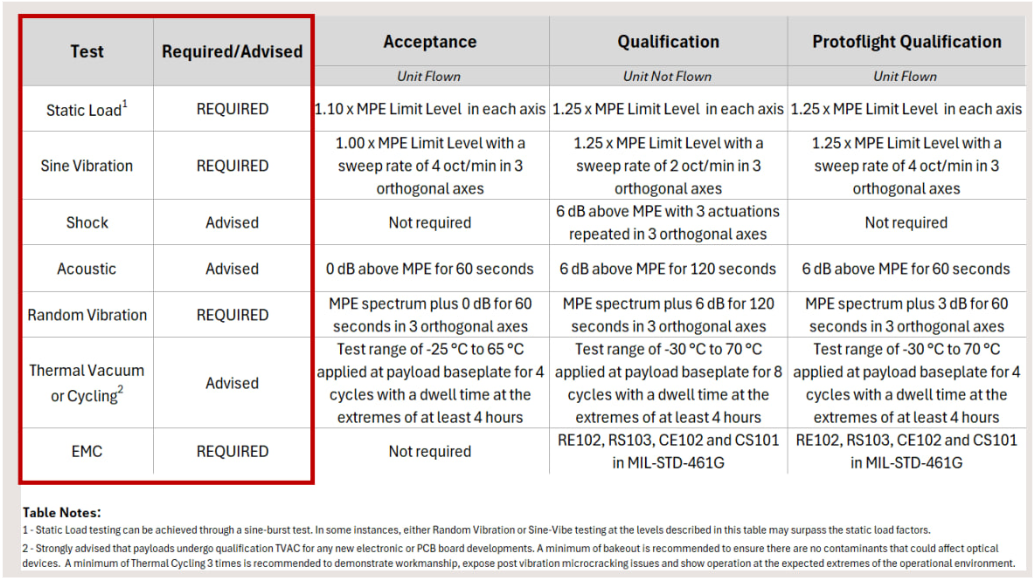
We have contacted ST Engineering and will be using their shaker facility and thermal chamber at Jalan Boon Lay. However, as EMC and static load testing capabilities are unavailable, they will be omitted.
To justify the omission of the static load test, we will perform a finite element simulation using SolidWorks to evaluate the module’s structural integrity. For EMC, as our module does not contain any parts without flight heritage that generate a frequency of more than 1.705 MHz, it can therefore be exempted under Item 9 of Section 15.103 of Federal Communication Commision (FCC) EMC compliance for North America EMC (Bayswater Pty Ltd, 2021). Table 5-1 below gives a summary of the tests done. Due to time constraints, the module was tested under Qualification Test conditions, which are the most stringent conditions. The protoflight qualification test for the actual flight module will be conducted at a later stage.
| No. | Test |
| 1 | Sine Vibration |
| 2 | Random Vibration |
| 3 | Thermal Cycling |
5.5 Test Setup
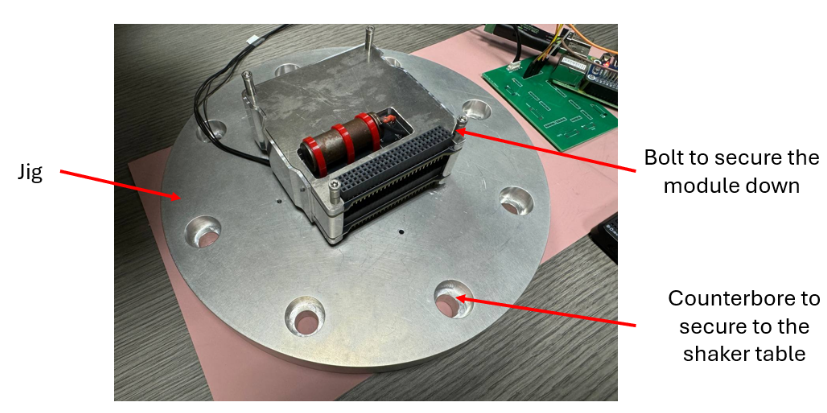
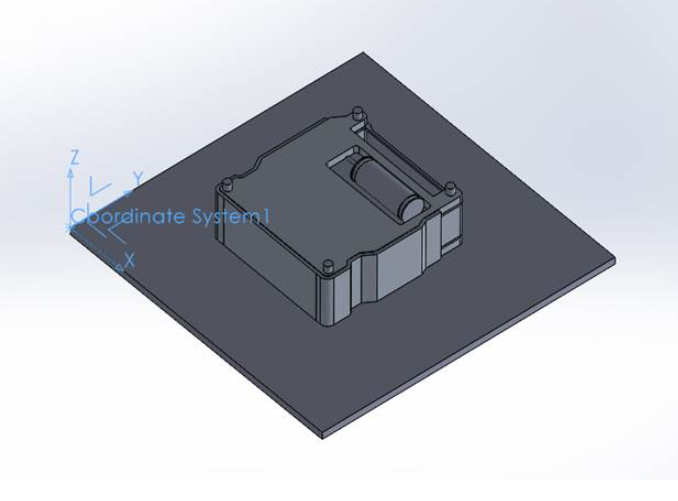
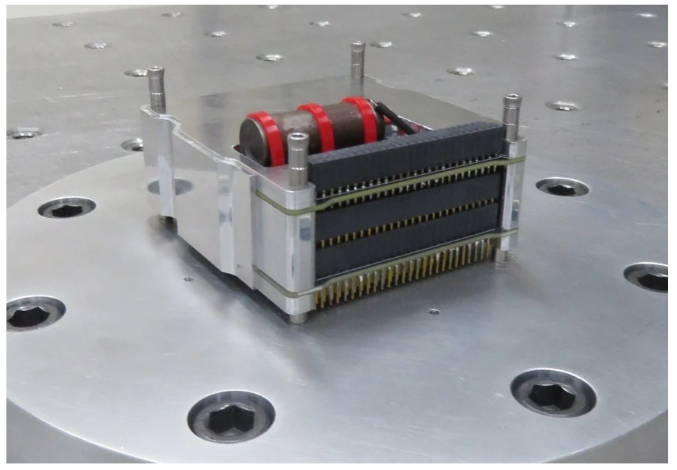
In order to conduct the mechanical tests, an adapter is required to secure the module onto the shaker table. After visiting the facility and consulting with the engineers, we decided to manufacture a jig. This jig will act as an adaptor to hold our module onto the shaker table, as shown in Figure 5-6 below. CAD drawing of the jig can be found in Appendix E7.
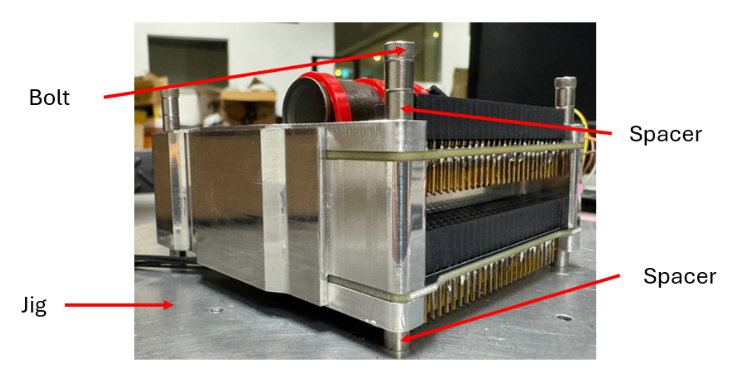
The module will be tested in this configuration, with the high voltage on top as shown in Figure 5-7. This simulates the module’s orientation during launch within the actual satellite. Spacers are also required at the top and bottom to simulate actual interfacing. Another benefit of this orientation is that the centre of gravity of the module will be lower, making it more stable.
A tightening torque will be required to secure the bolts down onto the jig. This is to ensure that the bolt is not overtightened and the threads and bolts are not damaged. Using a socket head bolt, we will be using a torque of 2.20Nm (Monster Bolts, n.d.). However, since the exact material grade of the bolt is unknown and testing showed that 2.20Nm caused rounding, we will use a smaller torque of 1.40Nm instead.
5.6 Tests
For the mechanical tests, we will be using the following coordinate system as the lateral and axial directions, shown in Figure 5-8 and Table 5-2. A brief summary of the test profile will be shown below. A detailed breakdown of the testing profiles can be found in Appendix E8.
| Axes | Direction |
|---|---|
| Z | Axial |
| X | Lateral 1 |
| Y | Lateral 2 |
Sine Vibration:
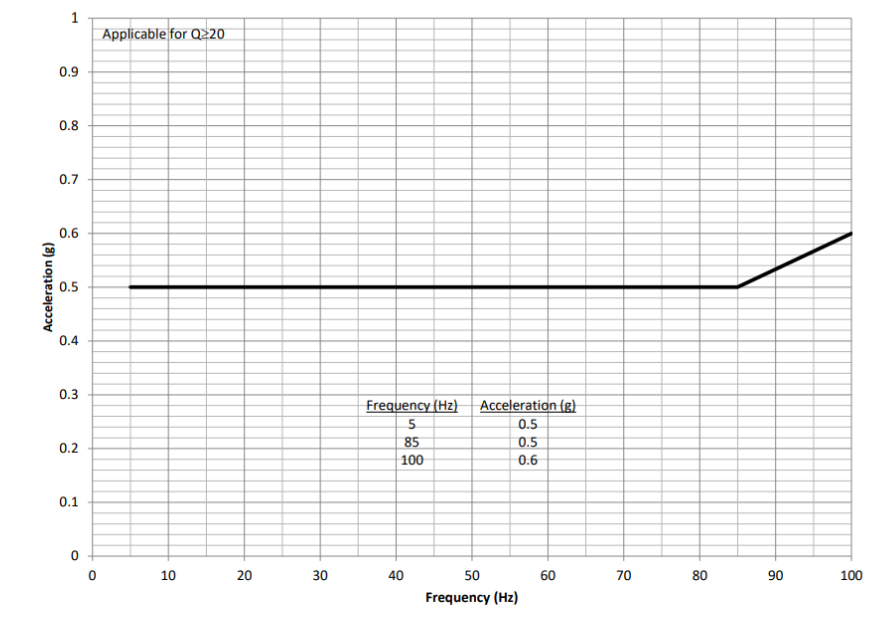
Sine vibration testing will be conducted along all three axes, one axial and two lateral. A safety factor of 1.25 Maximum Predicted Environment (MPE) will be incorporated for the Qualification test. Simulations indicate that the module is rather structurally stiff due to its compact size, and therefore has a high Q-value. As such, the selected test profile of Q values > 20 is suitable for our module. Each sine vibration test was conducted for a total duration of 130 seconds per axis.
Axial
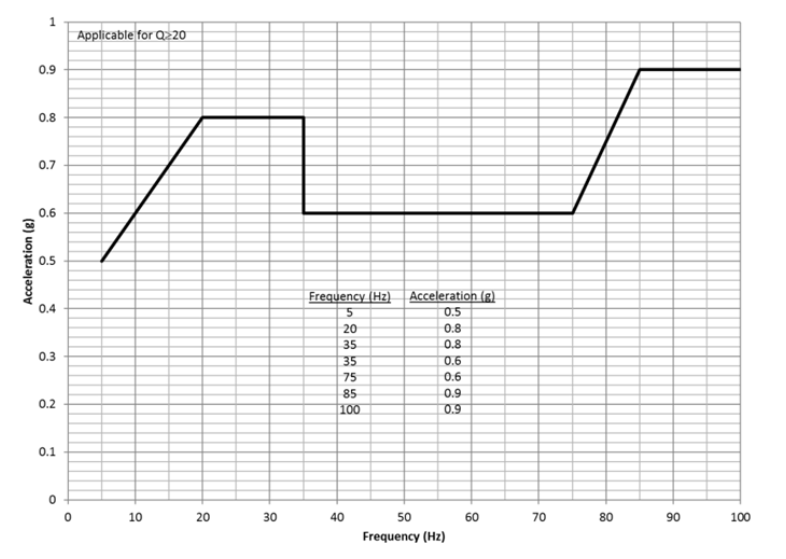
Lateral
Random Vibration
The following profile will be used for random vibration for all 3 axes. A safety factor of +6dB (MPE) is required for the Qualification test. Random vibration was run for 120 seconds each time, for each axis.
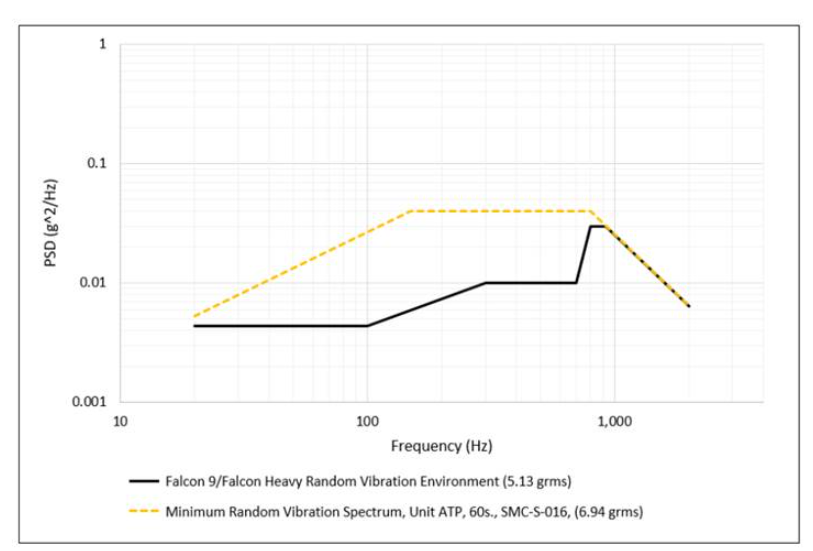
| Frequency | Falcon 9/Heavy Payload, Vibration MPE, (P95/50), 5.13 GRMS |
|---|---|
| 20 | 0.0044 |
| 100 | 0.0044 |
| 300 | 0.01 |
| 700 | 0.01 |
| 800 | 0.03 |
| 925 | 0.03 |
| 2000 | 0.00644 |
| GRMS | 5.13 |
Thermal Cycling
We will be doing a truncated thermal cycle since it is not required. Instead of 8 cycles, we will be doing 2 cycles. In addition, for the first cycle, we will be doing a low peak of -25°C as the DC converter has a stated working temperature of -25°C for the lower limit. We will carry on with -30°C only for the second cycle. Table 5-4 below is a summary of the specifications of the thermal cycle and Table 5-5 is the procedures.
| No. | Description | Specification |
|---|---|---|
| 1 | Starting Temp | Room Temperature (assume 20°C) |
| 2 | High Peak Temperature | 70°C |
| 3 | Low Peak Temperature | -25 and -30°C |
| 4 | Dwell Time* | 4 hours |
| 5 | Ramp Cycles | 10°C/minute |
| 6 | Cycles | 2 |
| No. | Description | Time |
|---|---|---|
| 1 | Room temperature (20°C) decrease to low peak temperature (-25°C) | 4.5 minutes |
| 2 | Dwell at low peak temperature | 4 hours |
| 3 | Low peak temperature (-25°C) increase to high peak temperature (70°C) | 9.5 minutes |
| 4 | Dwell at high peak temperature | 4 hours |
| 5 | High peak temperature (70°C) decrease to low peak temperature (-30°C) | 10 minutes |
| 6 | Dwell at low peak temperature | 4 hours |
| 7 | Low peak temperature (-30°C) increase to high peak temperature (70°C) | 10 minutes |
| 8 | Dwell at high peak temperature | 4 hours |
| 9 | High peak temperature (70°C) decrease to room temperature (20°C) | 5 minutes |
| - | Total time | 16 hours 39 minutes |
5.7 Simulations and limitations
Before conducting the actual physical tests, we performed simulations to validate the structural integrity of the module. This ensures that the design was mechanically sound and unlikely to fail under test conditions. Additionally, static load simulation was used as a substitute for the physical static test, which could not be performed due to facility constraints. A summary of all simulation results can be found in Appendix E9.
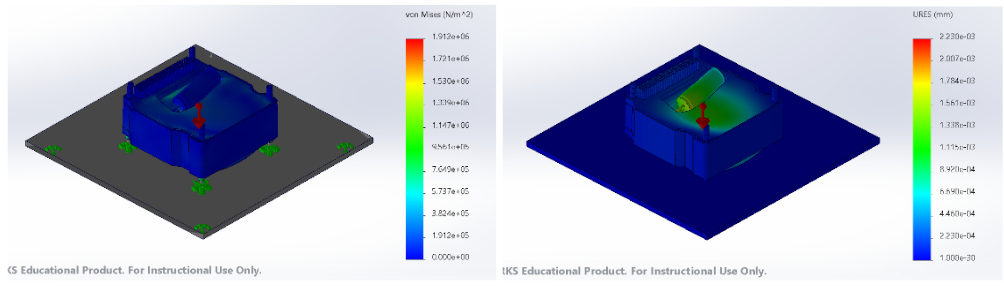
5.7.1 Static Load
We ran a static loading test to replicate the gravitational forces experienced during launch, using the load profile in Figure 5-12. As our module is small, the resulting stress and displacement values were minimal, as shown in Figure 5-13. Displacements are in the micrometers range and stress levels were below the material limit, 282 MPa ultimate stress for FR4 in PCB (Miraglia n.d., Wang et al., 2003) and 310 MPa in aluminium 6061 (ASM material data sheet, n.d.).
5.7.2 Sine Vibration
A sine vibration simulation was performed to identify the resonance frequencies and corresponding modes of the module. The results indicate that resonance mode occurs at approximately 2000 Hz. Upon closer inspection, multiple peaks are observed in the 2000Hz range. These are likely caused by the natural frequencies of the different components of the module. These peaks are expected in compact, stiff assemblies with multiple interfaces such as our module, where localized vibrations can give rise to closely spaced high-frequency modes.
| Mode No. | Frequency (Rad/sec) | Frequency (Hz) | Period (sec) |
|---|---|---|---|
| 1 | 12,661 | 2015.1 | 0.00049626 |
| 2 | 13,554 | 2157.2 | 0.00046356 |
| 3 | 13,727 | 2184.7 | 0.00045773 |
| 4 | 14,172 | 2255.6 | 0.00044334 |
| 5 | 14,265 | 2272.4 | 0.00043214 |
5.7.3 Thermal Test
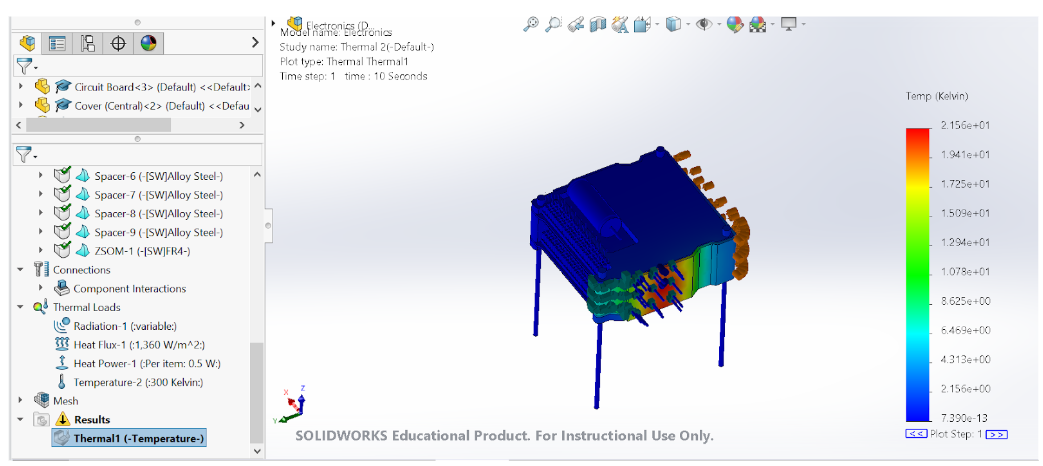
A thermal simulation was conducted to ensure that the module components do not overheat during operation. By inputting the expected heat output from the DC converter and estimated solar radiation flux, we modeled the temperature profile of the middle aluminium shielding, which serves as a heat sink. The results, as shown in Figure 5-14, indicate that the aluminium dissipates heat more rapidly than it accumulates, suggesting that the module will stay within safe operating temperatures under the expected thermal loads.
However, we acknowledge that the simulations are very crude and can only be used as a reference for our actual test, except for static loading since the actual test cannot be conducted.
5.8 Actual Test Results
We did sine vibration, full frequency sweep and random vibration tests. The full report of the tests can be found in Appendix E10.
5.8.1 Sine Vibration
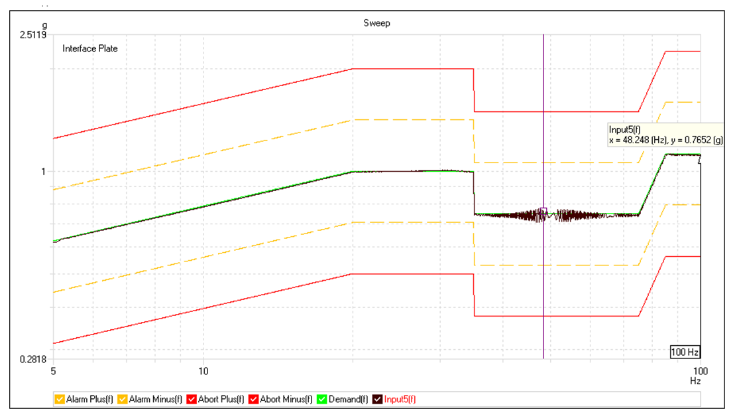
Sine vibration testing was conducted both before and after the thermal cycle to verify that the module’s mechanical integrity remained unchanged throughout the temperature exposure.
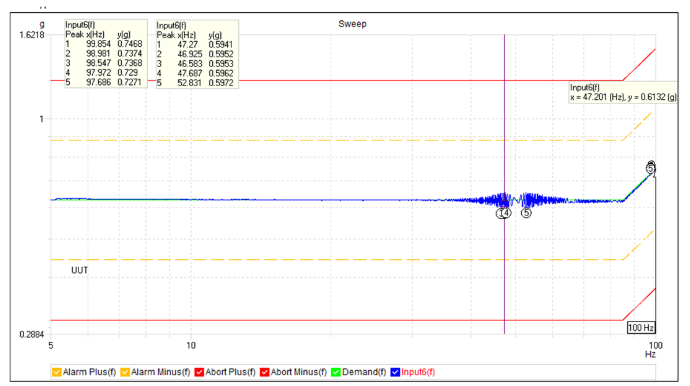
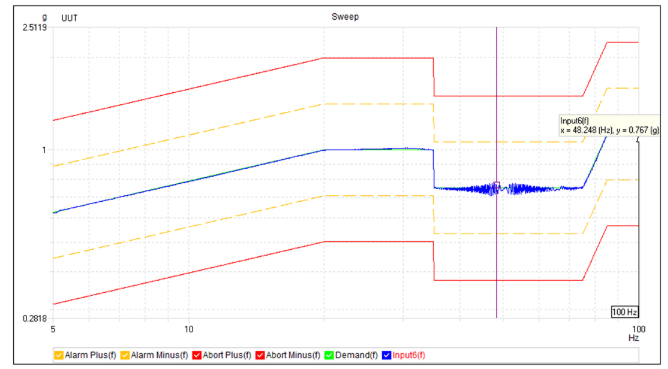
Based on the results, we can conclude that the module successfully withstood the sine vibration test, with no loose components or structural degradation. Additionally, no resonance frequencies were detected in this range. The peaks observed in the figures above correspond to the vibration of the shaker system itself, as similar waveforms appeared in the sensor mounted on the shaker table as shown in Figure 5-19. The post-thermal cycle test also exhibits a similar profile, indicating that the module also survived thermal cycling without any degradation. Full vibration profiles are provided in Appendix E10.
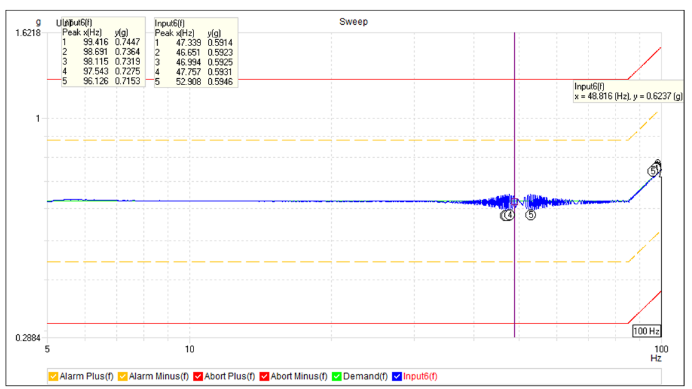
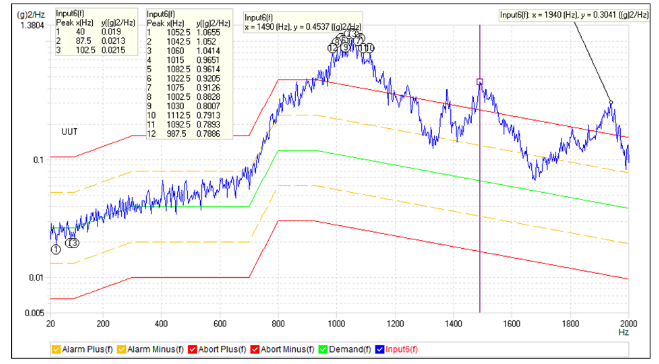
5.8.2 Full Frequency Sweep
A full frequency sweep from 20Hz to 2000Hz was performed to further characterize the resonance frequencies of the module. This test was conducted both before and after the thermal cycle to ensure that the thermal cycle did not alter the module’s structural integrity.
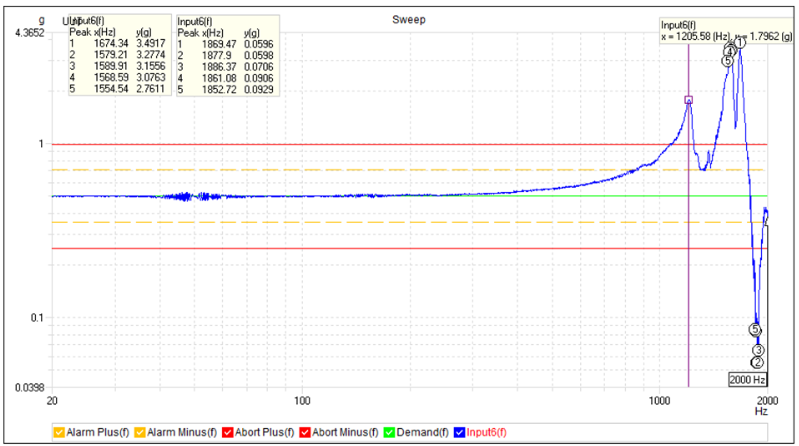
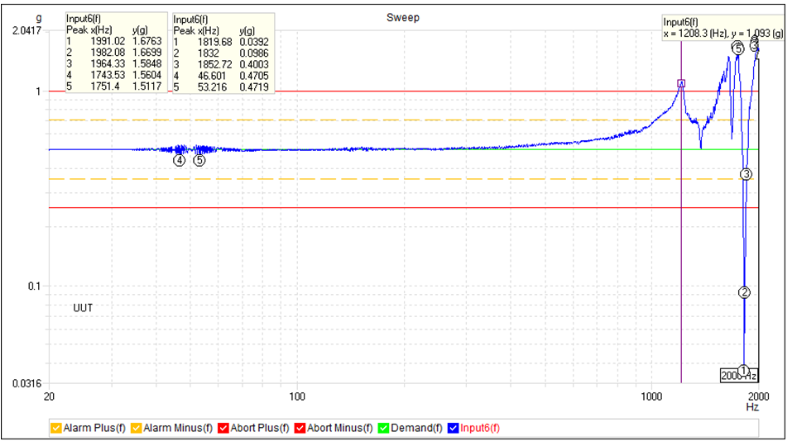
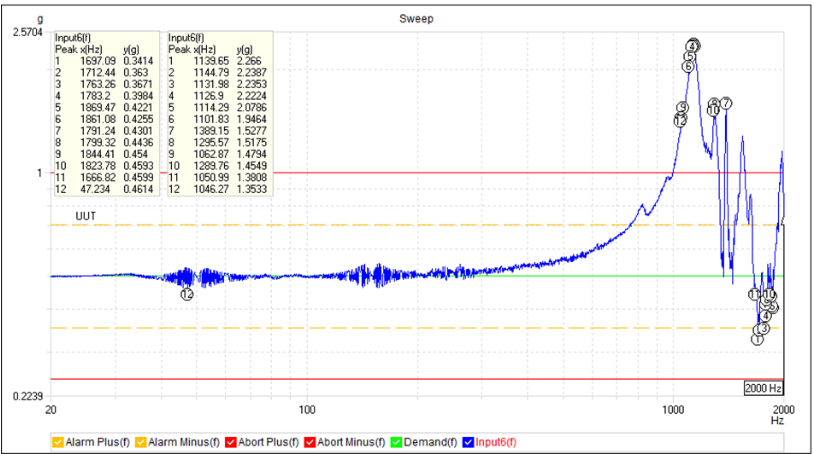
From the results, the resonance peak occurs at above 1000 Hz, with no significant amplification in the low-frequency range. Multiple peaks were observed at higher frequencies, which is similar to the simulations. They are likely attributed to the individual resonance frequencies of the various components, such as the PCBs and aluminium shielding. To validate survivability under these high-frequency conditions, we will conduct the random vibration test.
5.8.3 Random Vibration
Random vibration was also done before and after the thermal cycle. It subjects the module to a broadband spectrum of frequencies. This will ensure that the module can withstand potential resonance excitations during launch.
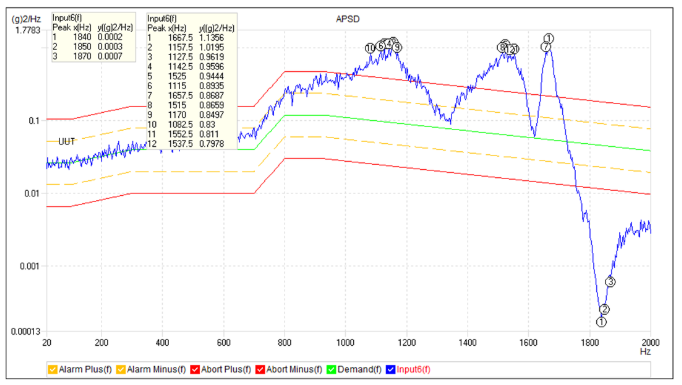
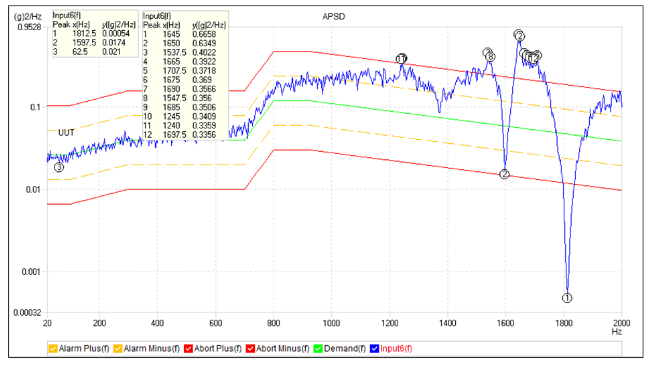
Random vibration results revealed similar resonance peaks to those observed in the full frequency sweep. With an input RMS acceleration of 11.1 g and a maximum response of 20.453 g, the module successfully withstood the test without damage or failure.
5.8.4 Thermal Cycling
The module successfully survived the thermal cycle as no component malfunction or structural degradation was observed. Functionality was verified before, during, and after the cycle. The measured mass of the module before and after the thermal cycle was consistent at 391 grams, indicating that there is no mass loss. The mass here is 2.5 grams higher than the value listed in the bill of materials as nuts were to hold the components together instead of spacers. More details of the cycle can be found in Appendix E10.
| Test | Conclusion | Pass/Fail |
|---|---|---|
| Sine vibration | No peaks at low frequency | Pass |
| Full frequency sweep | Resonance peaks at high frequencies of over 1000Hz | Pass |
| Random vibration | Response RMS within 2 times of input RMS, module survived the 120s of random vibration test. | Pass |
| Thermal cycle | Module worked before, during and after the cycle. No mass loss was detected. | Pass |
5.9 Conclusion
In conclusion, the final module design was achieved after multiple design iterations. It separates the high and low-voltage components to ensure modularity and electrical safety. The shielding also enables the evaluation of radiation effects under both unshielded and 2mm shielded conditions.
To verify the module’s suitability for launch and space conditions, it was subjected to vibration and thermal cycle qualification tests. Based on the test results, the module passed all required qualification tests and is expected to withstand launch conditions and operate reliably in orbit.
5.10 Future Work
For future work, we will need to send the final flight model for protoflight qualification testing, which will be conducted at a lower intensity compared to the qualification model tests. In addition, we can also search for overseas facilities that can conduct static loading and EMC tests, in order to gain a fuller understanding of the characteristic profiles of our module.
Next, we will need to find a rideshare opportunity and complete the mechanical and electrical interfacing. This is required in order to integrate our module into the main CubeSat platform. Following this, we will proceed with system-level testing with the rest of the CubeSat subsystems, so as to ensure full compatibility and functionality.
Once all testing and integration steps are completed, the module will be ready for launch.