Appendix E1: Iteration Designs
Details for previous iterations and material comparison can be found in the Interim Report.
First Iteration: All components on the same side of PCB, covered by 1 shield. Problems: Not enough space for all components.
Second Iteration: Shielded and unshielded components on opposite sides of the same PCB. Problems: Close proximity of high and low voltage components.

Third Iteration: PCBs for high and low voltage components. Shielded components on the inside of middle shielding. Problem: Thin structures (on the outside of pin stacks) which were vulnerable to vibrations and stress.
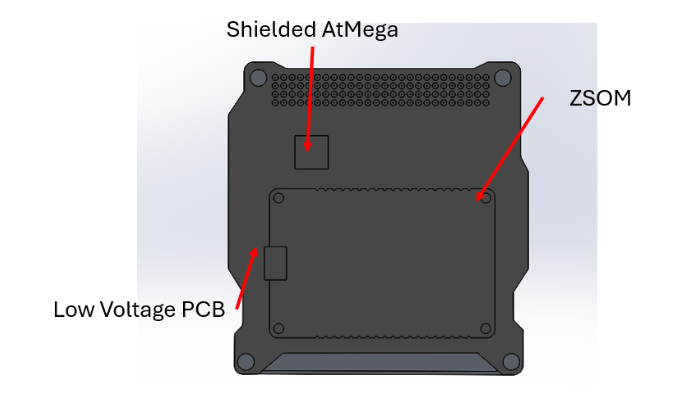
Final Iteration: Optimised design from 3rd iteration.
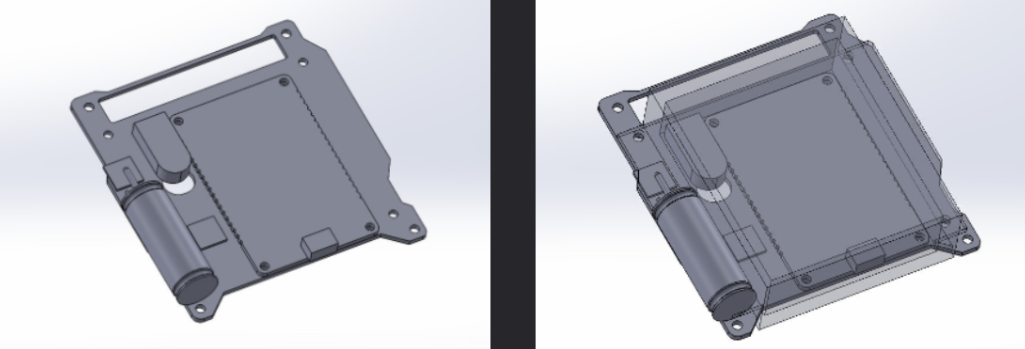
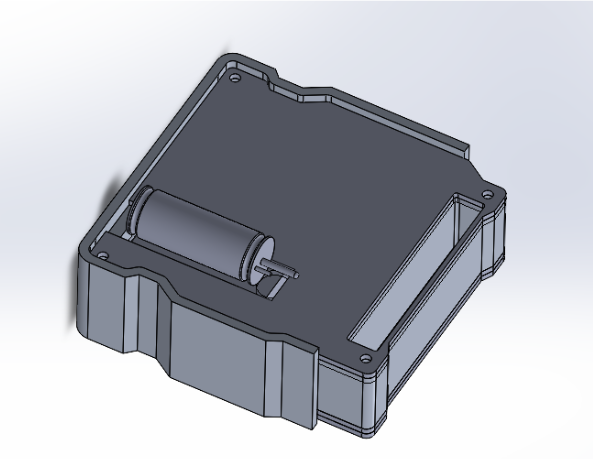
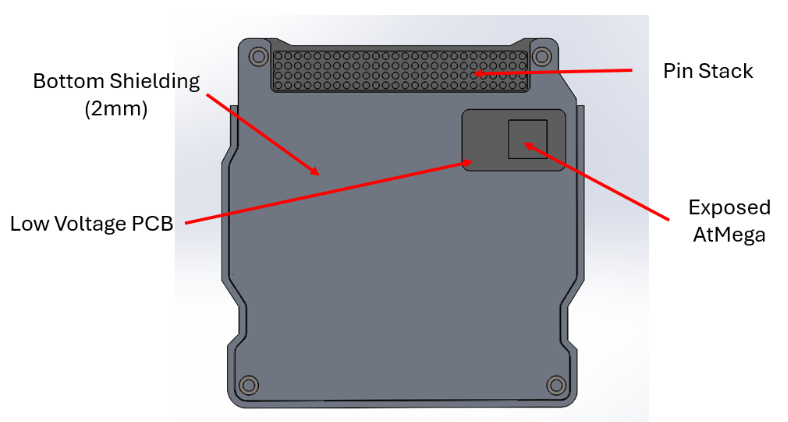
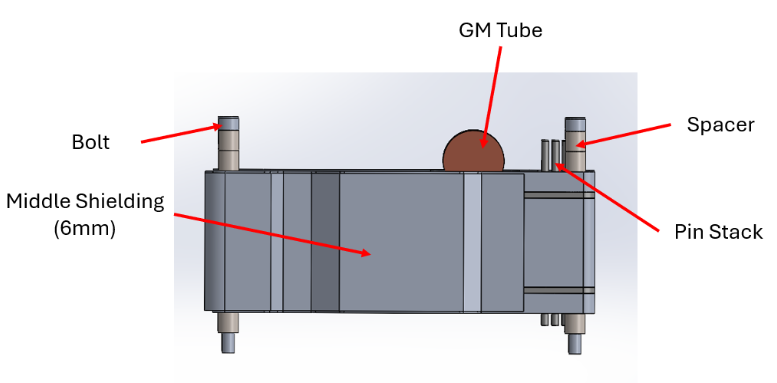
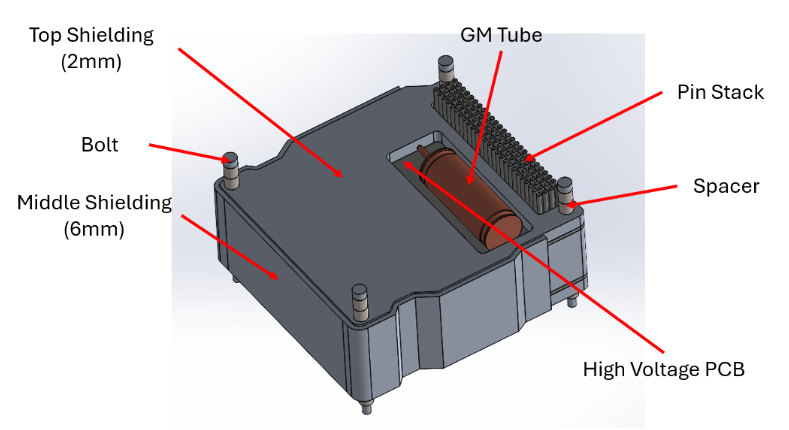
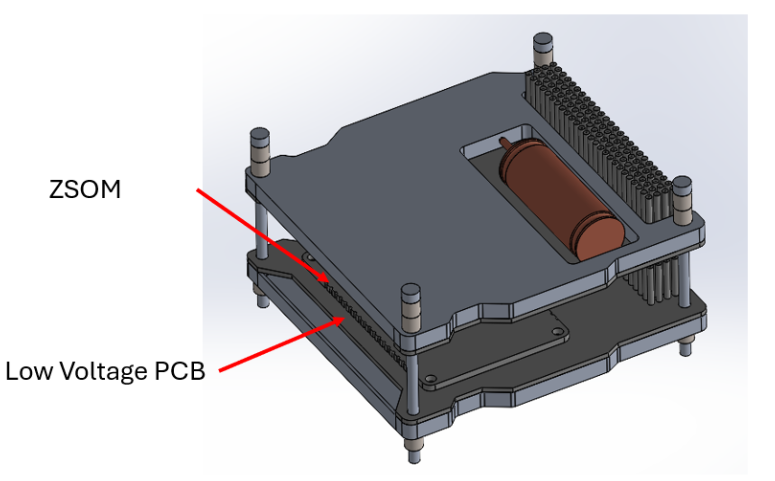
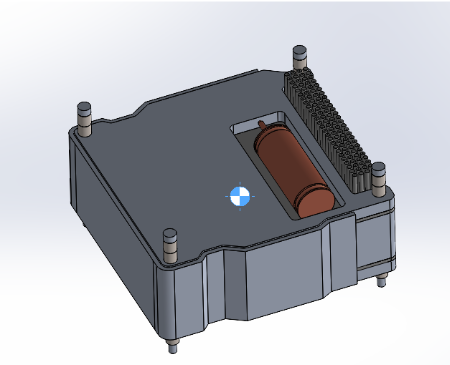
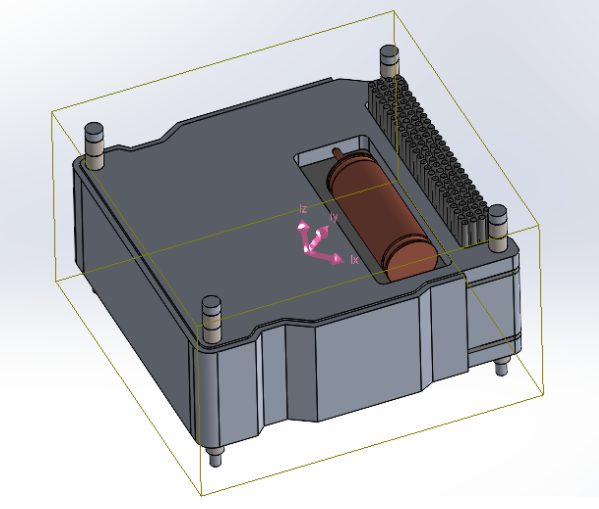
Appendix E2: CAD Models

Appendix E3: Material Choice Summary
Details of the materials can be found in the Interim Report.
| Material | Pros | Cons |
|---|---|---|
| PEEK |
|
|
| PEEK infused with heavy atoms |
|
|
| Aluminium 6061 |
|
|
| Concrete |
|
|
| Lead |
|
|
Appendix E4: Radiation Experiment Data
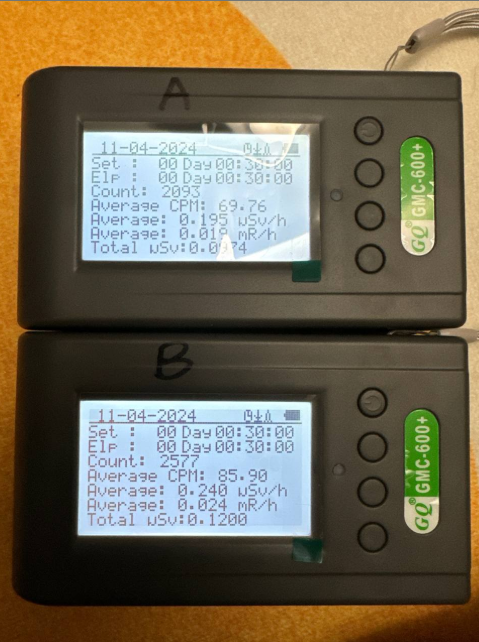
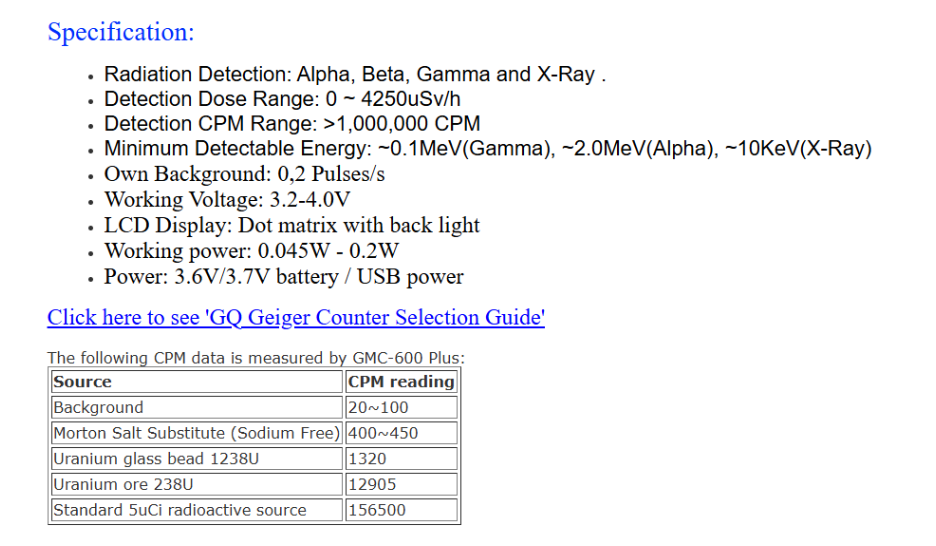
Background radiation can fluctuate from 20 to 100 CPM. (Link)
Each reading is 30 minutes. We first check whether the two counters are calibrated. A total of 7 readings are taken, with both GM Counters left outside.
| No. | Counter A | Counter B |
|---|---|---|
| 1 | 2598 | 2613 |
| 2 | 2612 | 2542 |
| 3 | 2586 | 2576 |
| 4 | 2624 | 2710 |
| 5 | 2655 | 2453 |
| 6 | 2587 | 2573 |
| 7 | 2534 | 2474 |
| Avg | 2599.43 | 2563.00 |
| CPM | 86.64761905 | 85.43333333 |
The counters are calibrated and have very close values.
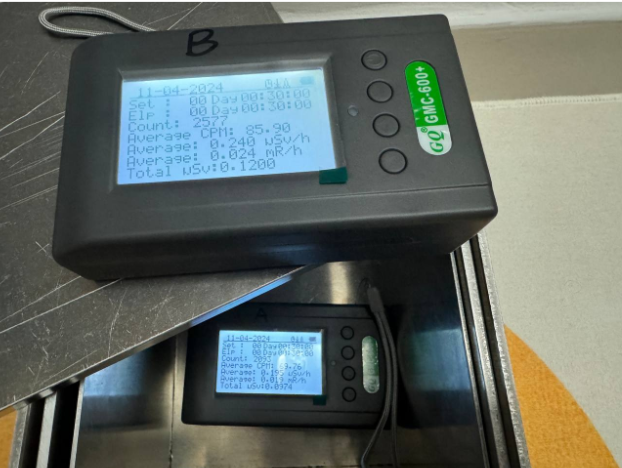
Next we put Counter A inside the box and Counter B outside the box and take the reading. We swap the two counters and take the readings again to average out any errors from their differences. Then we repeat for different thicknesses.
| Raw Data | Counter A | Counter B | Counter A | Counter B | ||
| Thickness | Inside Box (1) | Inside Box (2) | Inside Box (Average) | Outside Box (1) | Outside Box (2) | Outside Box (Average) |
| 0mm | 2598 | 2576 | 2587 | 2613 | 2586 | 2599.5 |
| 2mm | 2480 | 2428 | 2454 | 2496 | 2613 | 2554.5 |
| 4mm | 2247 | 2448 | 2347.5 | 2526 | 2579 | 2552.5 |
| 6mm | 2294 | 2262 | 2278 | 2596 | 2635 | 2615.5 |
| 8mm | 2258 | 2247 | 2252.5 | 2600 | 2548 | 2574 |
| 10mm | 2093 | 2079 | 2086 | 2557 | 2629 | 2593 |
We collect more data.
| Raw Data | Counter A | Counter B | Counter A | Counter B | ||
| Thickness | Inside Box (1) | Inside Box (2) | Inside Box (Average) | Outside Box (1) | Outside Box (2) | Outside Box (Average) |
| 0mm | 2547 | 2554 | 2550.5 | 2534 | 2572 | 2553 |
| 2mm | 2467 | 2429 | 2448 | 2578 | 2497 | 2537.5 |
| 4mm | 2389 | 2401 | 2395 | 2562 | 2554 | 2558 |
| 6mm | 2212 | 2365 | 2288.5 | 2510 | 2520 | 2515 |
| 8mm | 2176 | 2260 | 2218 | 2496 | 2495 | 2495.5 |
| 10mm | 2116 | 2230 | 2173 | 2470 | 2396 | 2433 |
We tabulate the data below.
| Thickness (mm) | Inside Box | CPM | Outside Box | CPM | Absolute Difference (CPM) | Percentage Drop |
|---|---|---|---|---|---|---|
| 0 | 2573.7 | 85.79 | 2576.3 | 85.88 | 0.09 | 0.10% |
| 2 | 2458.3 | 81.94 | 2546.0 | 84.87 | 2.92 | 3.44% |
| 4 | 2361.3 | 78.71 | 2555.3 | 85.18 | 6.46 | 7.59% |
| 6 | 2256.0 | 75.20 | 2565.3 | 85.51 | 10.31 | 12.06% |
| 8 | 2227.0 | 74.23 | 2534.8 | 84.49 | 10.26 | 12.14% |
| 10 | 2129.5 | 70.98 | 2513.0 | 83.77 | 12.78 | 15.26% |
Graph is plotted. It plateaus after 6mm.

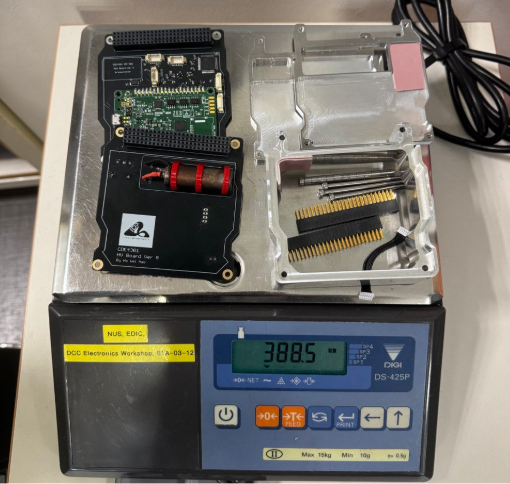
Appendix E5: Bill of Materials and Mass Budget
| Item | Material | Manufacturing Method | Mass (g) | Number of Counts | Total Mass (g) |
|---|---|---|---|---|---|
| Top Shielding | Aluminum 6061 | CNC | 47.5 | 1 | 47.5 |
| Bottom Shielding | Aluminum 6061 | CNC | 54.5 | 1 | 54.5 |
| Middle Shielding | Aluminum 6061 | CNC | 138.0 | 1 | 138.0 |
| HV PCB (Soldered) | FR4 | Bought | 56.0 | 1 | 56.0 |
| LV PCB (Soldered) | FR4 | Bought | 60.0 | 1 | 60.0 |
| Bolts | Stainless Steel | Bought | 3.0 | 4 | 12.0 |
| Spacer | Stainless Steel | Bought | 0.5 | 10 | 5.0 |
| Pin Stacks | Plastic and Copper | Bought | 6.5 | 2 | 13.0 |
| Thermal Interface Material | Thermal Interface Material | Bought | - | - | - |
| Total | 386.0 |
The precision of the scale was 0.5 grams. The mass of the full module is 388.5g.
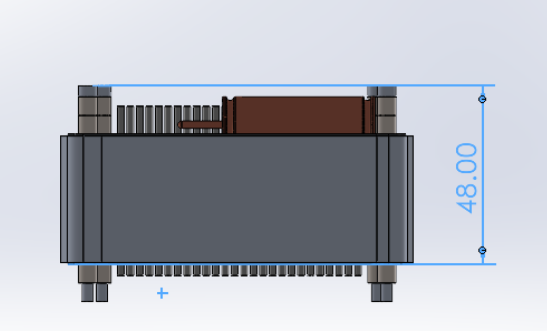
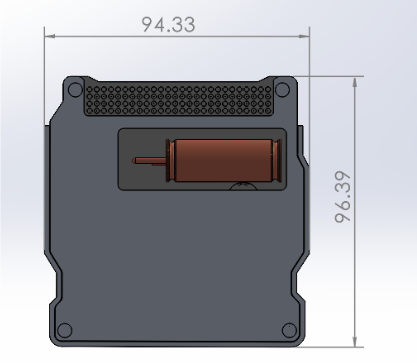
Appendix E6: Physical Parameters
Height: 48.0mm Length and Breadth: 96.39mm by 94.33mm
Centre of Gravity: X = 43.39mm Y = 48.03mm Z = -14.22mm

Moment of Inertia (at CG):
| Lxx = 387471.00 | Lxy = 15000.87 | Lxz = 16132.16 |
| Lyx = 15000.87 | Lyy = 397053.44 | Lyz = 23131.01 |
| Lzx = 16132.16 | Lzy = 23131.01 | Lzz = 648808.59 |
Appendix E7: Jig Drawing
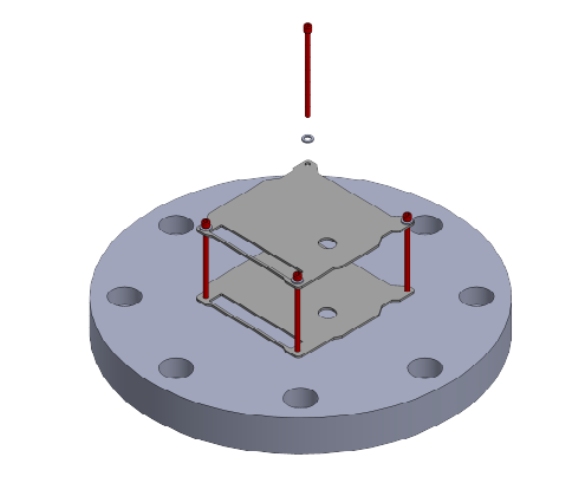
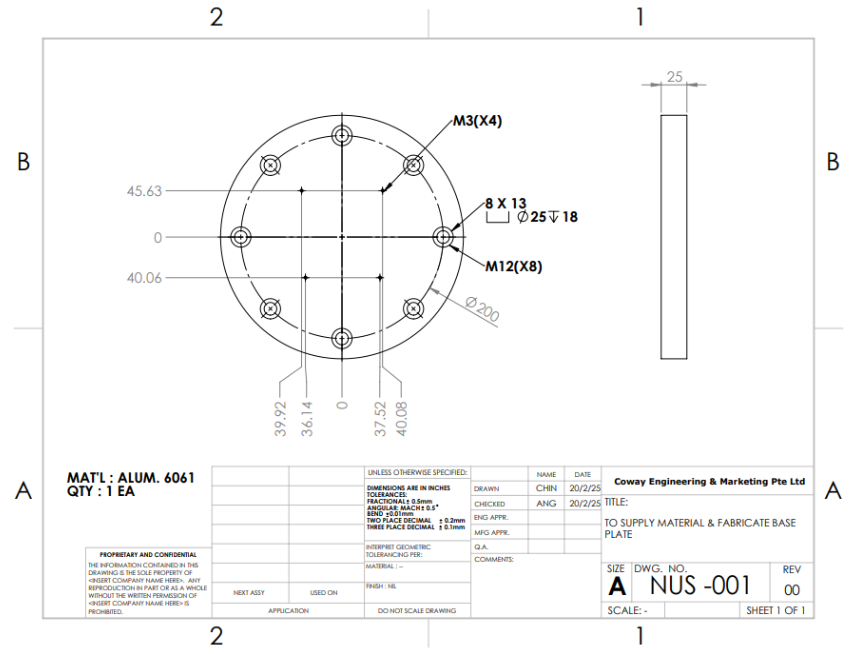
Note: There was some mistake by the manufacturer. In this drawing, the central hole is missing and the M3 holes were mirrored. The mistakes were subsequently fixed.
Appendix E8: Test Profiles
Test profiles are taken from SpaceX.
Sine Profile: (1.25x MPE)
Axial
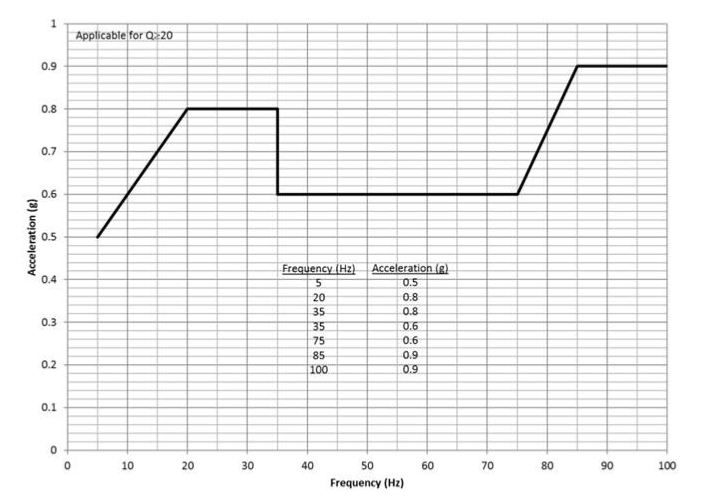
- Frequency range: 5 Hz to 100 Hz.
- Acceleration levels:
- 5Hz: ±0.5g * 1.25 = ±0.625g.
- 20Hz: ±0.8g * 1.25 = ±1.00g
- Peaks at ±0.9g * 1.25 = ±1.125g at 100 Hz.
| No. | Description | Time |
|---|---|---|
| 1 | Start at 5Hz and 0.625g amplitude | - |
| 2 | Increase frequency from 5Hz to 20Hz at a rate of 2 oct/min, increase amplitude linearly from 0.625g to 1.00g at 20Hz | 60 seconds |
| 3 | Increase frequency from 20Hz to 35Hz at a rate of 2 oct/min, amplitude remain at 1.00g | About 24.2 seconds |
| 4 | At the end of step 3, drop amplitude to 0.75g | - |
| 5 | Increase frequency from 35Hz to 75Hz at a rate of 2 oct/min, amplitude remain at 0.75g | About 33.0 seconds |
| 6 | Increase frequency from 75Hz to 85Hz at a rate of 2 oct/min, increase amplitude linearly from 0.75g to 1.125g at 85Hz | About 5.41 seconds |
| 7 | Increase frequency from 85Hz to 100Hz at a rate of 4 oct/min, amplitude remain at 1.125g | About 7.02 seconds |
| 8 | Repeat steps 1 to 7 one more time | About 130 seconds |
| 9 | End | - |
Total: about 260 seconds
Lateral
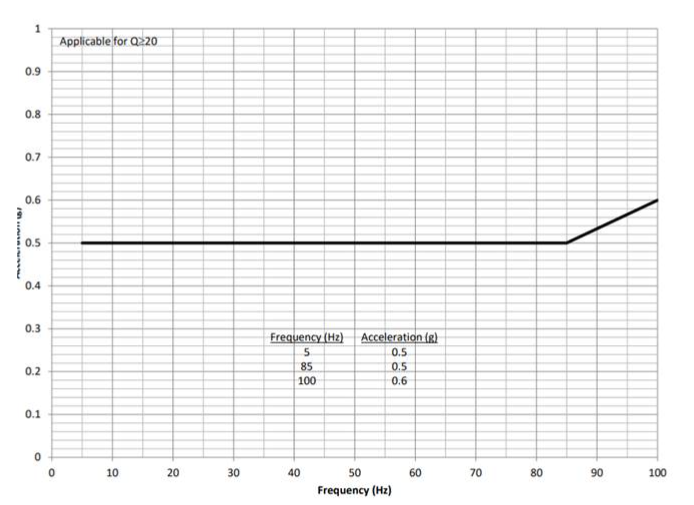
- Frequency range: 5 Hz to 100 Hz
- Acceleration levels:
- Constant ±0.5 * 1.25 = 0.625g between 5 Hz and 85 Hz.
- Peaks at ±0.6 * 1.25 = 0.75g at 100 Hz.
| No. | Description | Time |
|---|---|---|
| 1 | Start at 5Hz and 0.625g amplitude | - |
| 2 | Increase frequency from 5Hz to 85Hz at a rate of 2 oct/min, amplitude remain at 0.625g | About 120.6 seconds |
| 3 | Increase frequency from 85Hz to 100Hz at a rate of 2 oct/min, increase amplitude linearly from 0.625g to 0.75g at 85Hz | About 7.04 seconds |
| 4 | Repeat steps 1 to 3 one more time | About 130 seconds |
| 5 | Repeat steps 1 to 4 for the other lateral axis | About 260 seconds |
| 6 | End | - |
Total: about 520 seconds
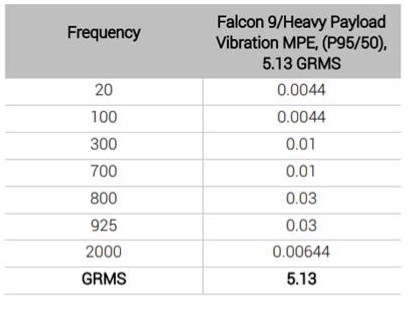
Random

All axes: Require +6dB (using Falcon)
| No. | Description | Time |
|---|---|---|
| 1 | Vibrate from 20Hz to 100Hz with constant 0.0264 g^2/Hz | 20s |
| 2 | Increase vibration from 100Hz with 0.0264 g^2/Hz to 300Hz with 0.04 g^2/Hz | 20s |
| 3 | Vibrate from 300Hz to 700Hz with constant 0.04 g^2/Hz | 20s |
| 4 | Increase vibration from 700Hz with 0.04 g^2/Hz to 800Hz with 0.12 g^2/Hz | 20s |
| 5 | Vibrate from 800Hz to 925Hz with constant 0.12 g^2/Hz | 20s |
| 6 | Decrease vibration from 925Hz with 0.12 g^2/Hz to 2000Hz with 0.03864 g^2/Hz | 20s |
| 7 | Repeat steps 1 to 6 two more times | 240s |
| 8 | Repeat steps 1 to 7 for the other two axes. | 720s |
| 9 | End | - |
Total: about 1080 seconds
Thermal Cycling
| No. | Description | Specification |
|---|---|---|
| 1 | Starting Temp | Room Temperature (assume 20°C) |
| 2 | High Peak Temperature | 70°C |
| 3 | Low Peak Temperature | -25 and -30°C |
| 4 | Dwell Time* | 4 hours |
| 5 | Ramp Cycles | 10°C/minute |
| 6 | Cycles | 2 |
| No. | Description | Time |
|---|---|---|
| 1 | Room temperature (20°C) decrease to low peak temperature (-25°C) | 4.5 minutes |
| 2 | Dwell at low peak temperature | 4 hours |
| 3 | Low peak temperature (-25°C) increase to high peak temperature (70°C) | 9.5 minutes |
| 4 | Dwell at high peak temperature | 4 hours |
| 5 | High peak temperature (70°C) decrease to low peak temperature (-30°C) | 10 minutes |
| 6 | Dwell at low peak temperature | 4 hours |
| 7 | Low peak temperature (-30°C) increase to high peak temperature (70°C) | 10 minutes |
| 8 | Dwell at high peak temperature | 4 hours |
| 9 | High peak temperature (70°C) decrease to room temperature (20°C) | 5 minutes |
| - | Total time | 16 hours 39 minutes |
Over Testing Procedures
| No. | Test | Time |
|---|---|---|
| 1 | First Sine | About 15 minutes |
| 2 | First Random | About 20 minutes |
| 3 | Thermal | About 16 hours 41 minutes |
| 4 | Second Sine | About 15 minutes |
| 5 | Second Random | About 20 minutes |
Total: about 2 days
Appendix E9: Simulations
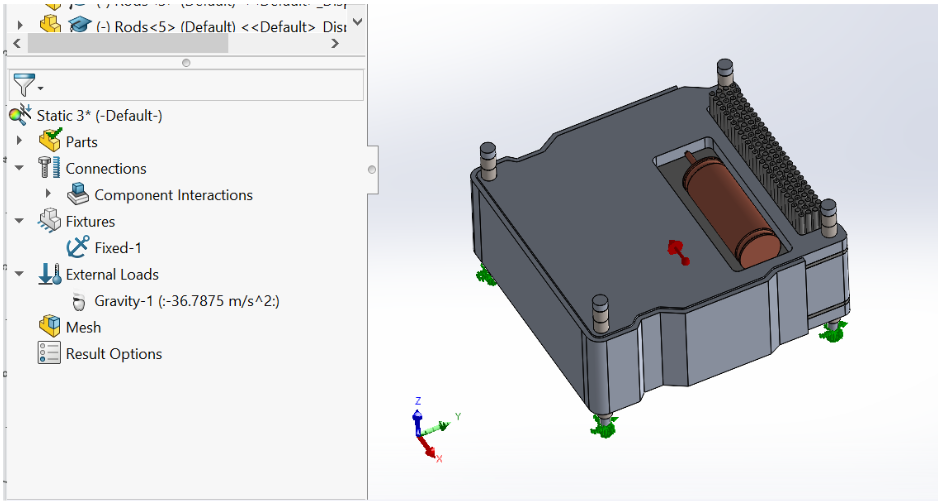
Static
Required Profile:
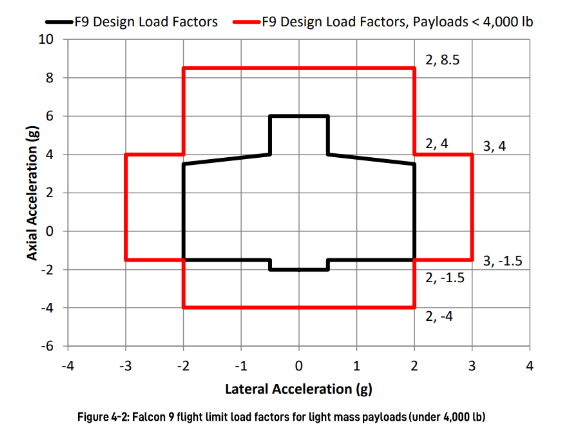
Axial: 1.25 * 8.5g
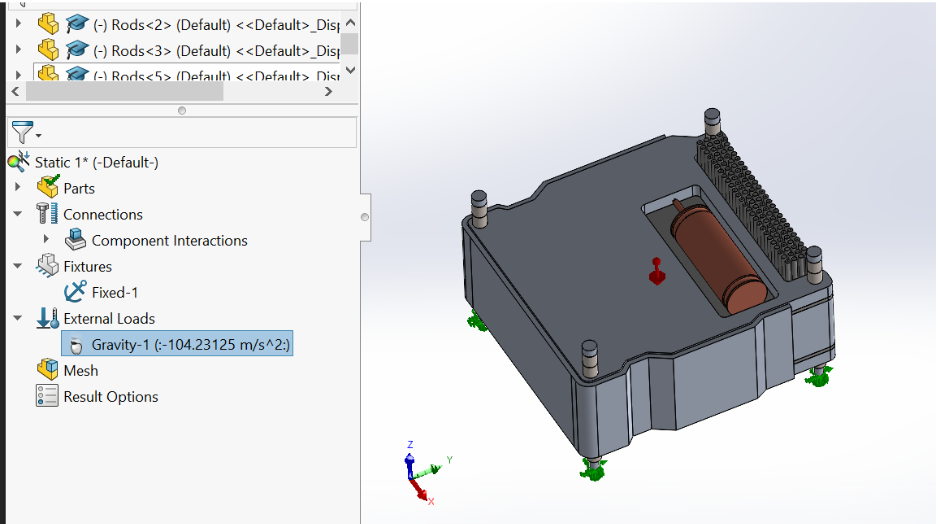
Lateral: 1.25 * 3g

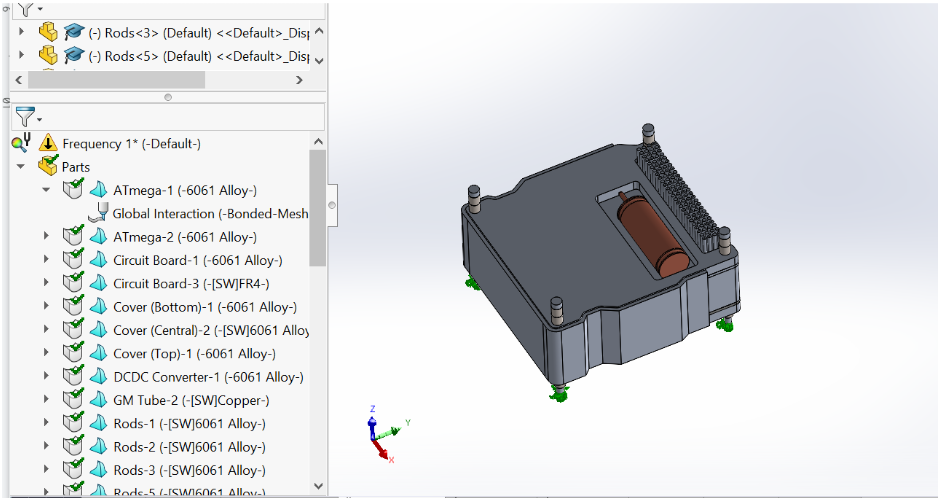
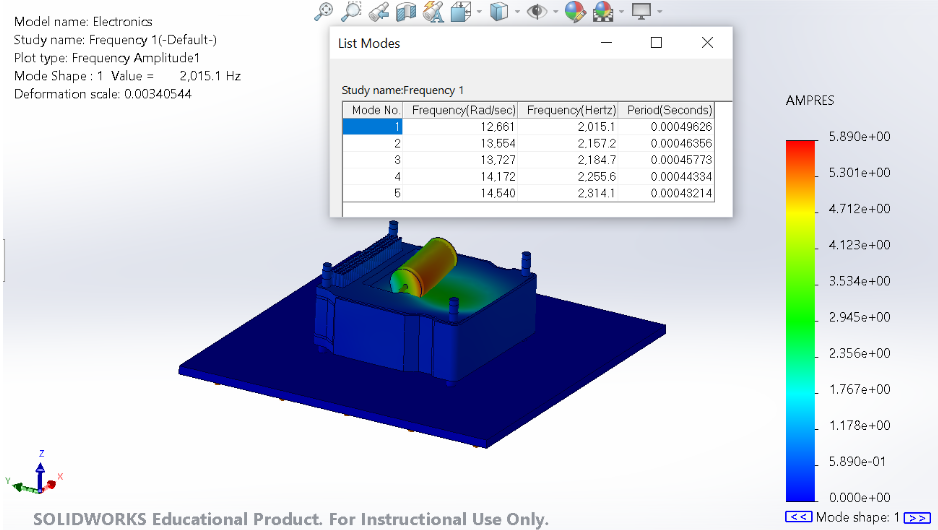
Sine Frequency
Find the resonance frequency
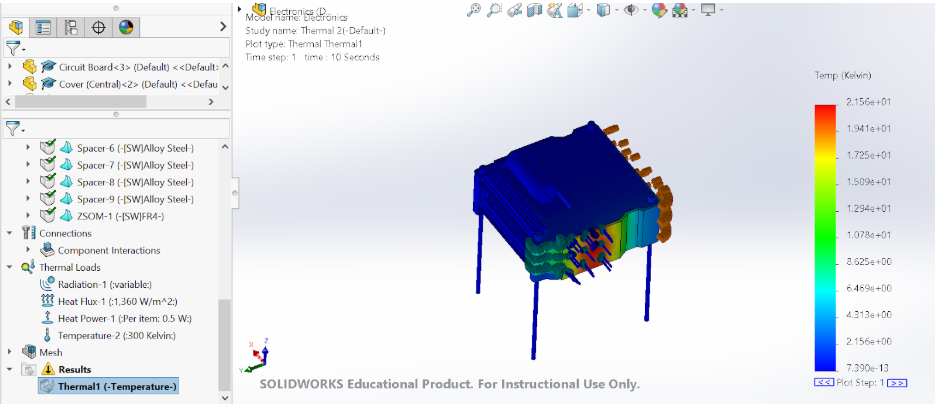
Thermal
Check for overheating
Appendix E10: Test Results
Vibration results before thermal cycle: Link
Thermal cycle data: Link
Vibration results after thermal cycle: Link
Appendix E11: Usable area of PCB and Size of Components
| Item | Dimensions (mm by mm) | Area (mm^2) | Usable Height (mm) |
|---|---|---|---|
| PCB | 94.39 x 90.33 | 8526.25 | - |
| Usable PCB Plate (Inner Side) | 70.75 x 57.79 | 4088.64 | 20mm |
| Usable PCB Plate (Outer Side) | 70.75 x 57.79 | 4088.64 | 3mm |
| Pin Stack | 2.5 x 2.5 | 6.25 | 3mm |
| Item | Dimensions (mm by mm) | Area (mm^2) | Height (mm) |
|---|---|---|---|
| Z-SOM | 68.00 x 45.00 | 3060.00 | 3.00 |
| AT-Mega | 10.00 x 10.00 | 100.00 | 2.00 |
| GM Tube | 49.20 x 15.10 | 742.92 | 15.10 |
| HV Converter | 28.00 x 15.00 | 420.00 | 8.00 |